Category: Finance

  • QuidelOrtho: A Post-Merger Dissection of Strategy, Financial Health, and Innovation

    QuidelOrtho: A Post-Merger Dissection of Strategy, Financial Health, and Innovation

    Executive Summary

    The 2022 merger of Quidel Corporation and Ortho Clinical Diagnostics was designed to create a comprehensive diagnostics leader.¹ The strategy paired Quidel’s point-of-care agility with Ortho’s global laboratory strength.

    However, the post-merger period proved challenging. The rapid decline of high-margin COVID-19 testing revenue exposed significant financial and integration difficulties. This situation culminated in a decisive course correction in early 2024. The board replaced the merger’s architect and installed a new C-suite with a clear mandate for change.²

    QuidelOrtho is now in a fundamental turnaround. The company has pivoted from a strategy of “growth via merger” to one of “profitability via integration.” Under new leadership, the focus is intensely on operational efficiency, aggressive cost-saving, and prioritized debt reduction. The recent decision to discontinue the long-gestating Savanna® molecular platform in favor of acquiring a more promising external technology exemplifies this new, unsentimental approach.³

    Significant risks remain, particularly the company’s substantial debt and recent negative cash flow.⁴ However, the path forward is now clearer. The new strategy is expected to restore profitability, strengthen the balance sheet, and drive long-term value through disciplined execution and focused innovation.

    (more…)
  • Analysis of Vitalik Buterin’s Influence and Communication in the 2025 Crypto Landscape

    Executive Summary

    This report analyzes the market influence and public communication of Ethereum co-founder Vitalik Buterin as of October 2025.

    Buterin’s known Ethereum (ETH) holdings represent approximately 0.2% of the total circulating supply. This amount is insufficient to cause systemic market volatility on its own.¹ On-chain activity and public statements confirm his ETH transfers are overwhelmingly philanthropic; they are not for personal financial gain.²

    A quantitative review of Buterin’s public communications reveals a significant increase in activity during 2024 and 2025.³ This contradicts the perception that he has grown silent. This perception gap stems from a broader market shift. The crypto ecosystem is now saturated with high-volume, accessible narratives from prominent figures and cultural phenomena like political meme coins.⁴ Buterin’s discourse has become more technical and specialized. While more frequent, louder narratives are overshadowing his contributions.

    This analysis concludes that Buterin’s role has evolved. He is no longer a direct market actor but a long-term technical and ethical steward for the Ethereum ecosystem. His influence is now primarily exerted through his intellectual contributions, which shape the network’s development.⁵

    (more…)
  • An Analytical Inquiry into the Corporate and Financial Dynamics of Red Cat Holdings and Unusual Machines

    An Analytical Inquiry into the Corporate and Financial Dynamics of Red Cat Holdings and Unusual Machines

    Executive Summary

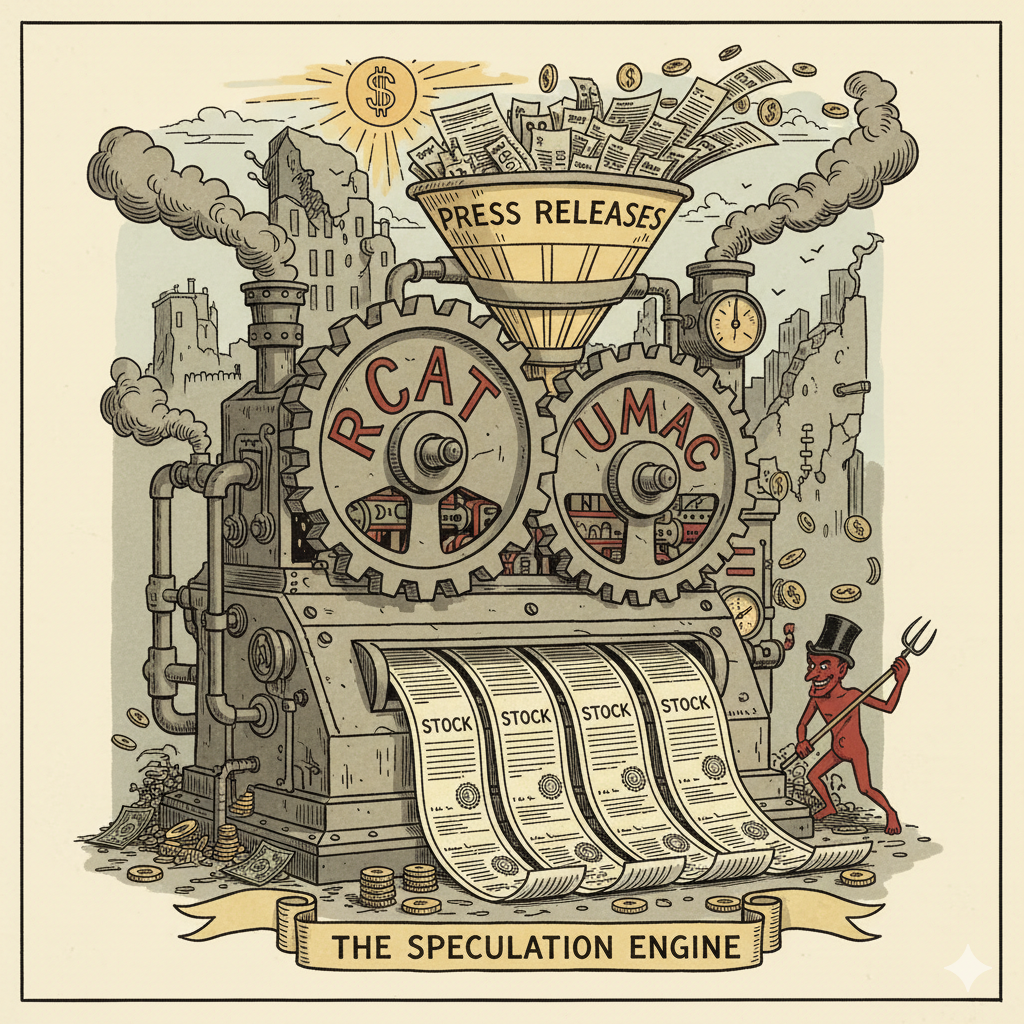
    An in-depth investigation reveals a sophisticated and potentially fraudulent ‘Dilution-Hype Cycle.’ This cycle is at the core of Red Cat Holdings, Inc. (NASDAQ: RCAT) and Unusual Machines, Inc. (NYSE American: UMAC). The scheme appears strategically designed to perpetually extract capital from public markets.

    This report details the interconnected corporate structure between the two companies. It analyzes the financial mechanics of their capital-raising activities and deconstructs their product and contract claims.

    Our findings indicate the relationship between RCAT and UMAC is not a standard, arm’s-length corporate separation. It originated from RCAT’s divestiture of its consumer division. This move appears to be a strategic maneuver. It created a publicly-traded, controlled entity to facilitate a cycle of capital raising and stock promotion.

    Key elements of this structure include:

    • A Controlled Spin-Off: RCAT spun off its Rotor Riot and Fat Shark brands into UMAC. The transaction was paid for predominantly with UMAC stock, establishing RCAT as UMAC’s largest shareholder.
    • Interlocking Management: A key RCAT executive was transferred to the CEO position at UMAC. This move ensures continued alignment and control.
    • Non-Arm’s-Length Transactions: The interconnected relationship enables self-serving deals. A widely publicized $800,000 component order from RCAT to UMAC, for example, served to generate a positive news cycle and inflate the stock prices of both entities.

    Both companies are characterized by significant and persistent unprofitability. This makes them dependent on the capital markets for survival. They service this dependency through a continuous pattern of dilutive stock offerings, frequently managed by a common underwriter, ThinkEquity. This process appears to be the core business model.

    Furthermore, third-party analysis has challenged the veracity of the companies’ product claims and contract values. Allegations suggest key products are rebranded consumer drones with Chinese-made components. The analysis also claims the value of a pivotal government contract has been significantly overstated, creating a potential revenue shortfall of approximately $57 million.¹

    These activities, viewed in aggregate, bear the hallmarks of a coordinated stock promotion and financing scheme. The scheme utilizes related-party transactions and a circular corporate structure. The primary objective appears to be generating hype to facilitate the continuous sale of equity, a practice that may not serve the best interests of independent shareholders.

    (more…)
  • Deconstructing the Crypto Market Collapse of October 10, 2025

    On October 10, 2025, a single geopolitical announcement triggered the largest deleveraging event in the history of digital assets, exposing the fragile, overleveraged core of a euphoric market. This was not just a market crash; it was a Black Swan event that stress-tested the entire crypto ecosystem, revealing its deepest vulnerabilities and its surprising strengths.

    Executive Summary

    The cryptocurrency market was shattered on Friday, October 10, 2025, by what appeared to be a singular geopolitical shock. In reality, it was the catastrophic failure of a market structure defined by extreme leverage and paradoxical sentiment. This historic deleveraging event, the largest in the history of digital assets, demonstrated the profound systemic risks that had built up beneath a surface of bullish euphoria.

    President Donald Trump’s announcement of 100% tariffs on China was the undeniable catalyst. However, this report will show that the collapse resulted from a dangerous confluence of factors. The market was primed for volatility by a widely accepted “debasement trade” narrative, where a US government shutdown was ironically seen as a tailwind for asset prices. This perception led to all-time highs for Bitcoin and an unprecedented buildup of speculative, leveraged long positions.

    The tariff announcement acted as a pinprick to this overleveraged bubble, triggering a violent liquidation cascade that erased between $9.5 billion and $19 billion from derivatives markets in 24 hours.¹³, ¹⁹ On-chain analysis reveals that the decentralized derivatives exchange Hyperliquid was the primary venue for this deleveraging.¹³ Furthermore, forensic evidence points to the strategic actions of sophisticated whale traders who not only anticipated the market’s vulnerability but also positioned themselves to profit immensely from the chaos.², ¹² This suggests the event was both a market-wide panic and a predatory hunt.

    The analysis concludes with an assessment of the market’s structural health in the aftermath, identifying key indicators that will define its trajectory and offering a forward-looking perspective for navigating the new paradigm.

    (more…)
  • The Payments Duopoly: A Comparative Analysis of the Visa and Mastercard Business Models

    Executive Summary

    Visa Inc. and Mastercard Incorporated form one of the global economy’s most powerful duopolies. While their brands are ubiquitous, the mechanics of their business models are often misunderstood. This report provides a comparative analysis of how these payment technology giants generate revenue.

    At their core, both companies operate on an identical foundation. They use an “open-loop,” four-party model that connects consumers, merchants, issuing banks, and acquiring banks. They are not financial institutions. They do not issue credit or assume the risk of consumer default. Instead, they operate the vast technology platforms—VisaNet and the Mastercard Network—that serve as the digital rails for global commerce. They earn fees on immense transaction volumes. However, this shared foundation gives way to increasingly divergent strategic priorities.

    The analysis reveals Visa’s clear dominance in scale. In fiscal year 2024, Visa processed $15.7 trillion in total volume across 233.8 billion transactions. This generated $35.9 billion in net revenue.¹ Its business model is deeply rooted in monetizing this scale through transaction-centric revenue streams: Data Processing, Service, and International Transaction fees.

    Mastercard is smaller, with $9.8 trillion in gross dollar volume and 159.4 billion switched transactions in fiscal year 2024.²,³ It has strategically positioned itself as a more diversified technology partner. This is most evident in its financial reporting, which is structured around two distinct pillars: the core Payment Network and a rapidly expanding Value-Added Services and Solutions (VAS) segment. In 2024, the VAS segment generated $10.83 billion. This accounted for a remarkable 38.5% of Mastercard’s $28.2 billion in total net revenue and is growing much faster than its core payments business.²,⁴

    This report concludes that the competitive dynamic between the two companies is evolving. The fundamental mechanism of earning fees on payment volume remains the bedrock for both. However, Visa’s strategy now focuses on leveraging its scale to expand its “network of networks” into new payment flows, like business-to-business payments. Mastercard, conversely, is executing a clear strategy of differentiation through services. It embeds itself more deeply with clients through offerings in cybersecurity, data analytics, and loyalty programs. The future of this duopoly will be defined less by processing payments and more by their ability to innovate and monetize the ecosystem of services surrounding the transaction.

    (more…)
  • An Analytical Overview of the FTSE China 50 Index Constituents: Q4 2025

    Decoding the FTSE China 50

    The FTSE China 50 Index is a real-time, tradable benchmark designed to provide international investors with exposure to the largest and most liquid Chinese companies listed on the Stock Exchange of Hong Kong (SEHK). Administered by FTSE Russell, the index comprises 50 constituents selected based on market value and liquidity, employing a transparent, rules-based methodology. To prevent over-concentration in any single entity, individual constituent weights are capped at 9% on a quarterly basis. This structure makes the index a critical tool for creating index-linked financial products, such as Exchange Traded Funds (ETFs) and derivatives, and serves as a key performance benchmark for global investors seeking access to the Chinese market through an established international exchange. This report provides a detailed profile of each of the 50 constituent companies, reflecting the index’s composition as of October 1, 2025. The list is current following the FTSE Russell Q3 2025 quarterly review, which concluded with no changes to the index’s membership.   

    Clarifying Index Composition: H-Shares, Red Chips, and P Chips

    A nuanced understanding of the FTSE China 50 requires a clear distinction between the types of share classes eligible for inclusion. Unlike indices focused on mainland-listed A-shares, the FTSE China 50 is composed exclusively of stocks traded on the SEHK, which fall into three specific categories designed for international investment. This composition is fundamental to the index’s role as a gateway for global capital into the Chinese economy.   

    • H Shares: These are securities of companies incorporated in the People’s Republic of China (PRC) but listed and traded on the Stock Exchange of Hong Kong. While subject to PRC corporate law, they are traded in Hong Kong Dollars and are freely accessible to international investors. This category typically includes China’s large, state-owned enterprises in foundational sectors like banking and energy. Examples within the index include Industrial and Commercial Bank of China (ICBC) and Petrochina.   
    • Red Chips: These are companies incorporated outside of the PRC (often in jurisdictions like Hong Kong or the Cayman Islands) but traded on the SEHK. A company qualifies as a Red Chip if at least 30% of its shares are held by mainland state entities and at least 50% of its revenue or assets are derived from mainland China. This structure represents state-controlled interests operating through an international corporate framework. CITIC Limited is a prominent example in the index.   
    • P Chips: Similar to Red Chips, P Chip companies are incorporated outside the PRC and trade on the SEHK. The key distinction is ownership: a P Chip is controlled by private-sector Mainland China individuals or entities, not the state. The company must also derive at least 50% of its revenue or assets from mainland China. This category includes many of China’s most dynamic and globally recognized technology and consumer companies, such as Tencent Holdings and Alibaba Group.   
    (more…)
  • An Autopsy of a Penny Stock: The Complete Timeline and Analysis of Sonim Technologies (SONM)

    The Anatomy of a 99% Decline

    For any trader, even one with a decade of experience, the trajectory of Sonim Technologies (NASDAQ: SONM) can appear baffling. The stock’s history is a maelstrom of extreme volatility, deep value destruction, and seemingly contradictory news. The central explanation for Sonim’s stock performance, however, is not found in complex market manipulation or a hidden, misunderstood value proposition. Rather, SONM’s chart is a direct and brutal reflection of a company that, despite possessing a well-defined product for a niche market, has been fundamentally unable to achieve sustained operational profitability since its public debut.

    This failure has locked the company in a classic “penny stock death spiral.” The narrative begins with a promising Initial Public Offering (IPO) in May 2019 at $11.00 per share. It quickly devolves into a story of chronic cash burn, which forced the company into a series of highly dilutive capital raises at progressively lower valuations. To maintain its Nasdaq listing in the face of a collapsing share price, the company was compelled to execute two separate 1-for-10 reverse stock splits, which only temporarily masked the relentless destruction of shareholder value. A 2022 takeover by a strategic investor, AJP Holding Company, brought a new management team and a strategic pivot, leading to a brief, illusory financial recovery in 2023 built on an unsustainable business line. This was followed by a disastrous 2024, characterized by a strategic reset that led to massive financial losses and a second reverse split.   

    This multi-year saga has culminated in the current endgame: a 2025 definitive agreement to sell the company’s core assets to Social Mobile for approximately $20 million. The stock’s recent volatility is not a sign of a potential turnaround but the speculative spasms of a distressed entity where trading on buyout rumors has replaced any semblance of fundamental valuation. The pending acquisition represents the likely final chapter for Sonim as an independent public company, crystallizing a more than 99% loss for its IPO investors.   

    (more…)